Understanding the Charts
Results charts
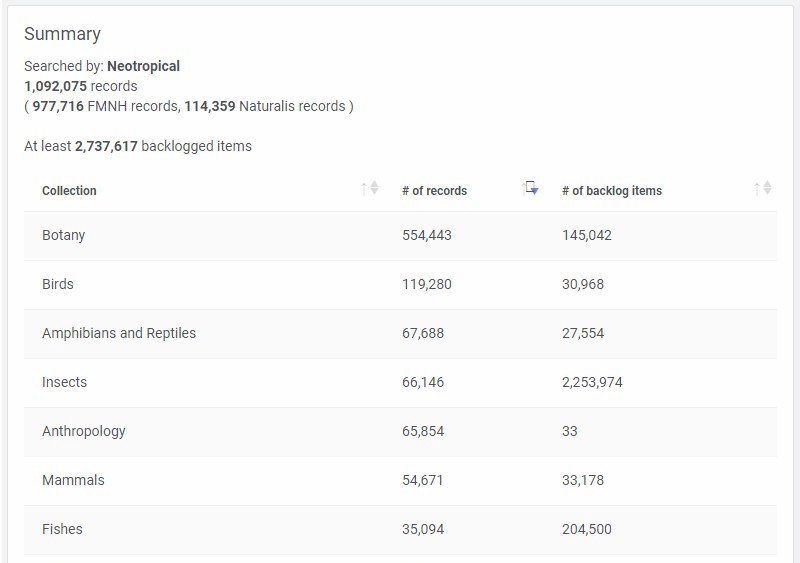
Summary Table
"# of items" and "# of backlog items" are specific to search criteria.
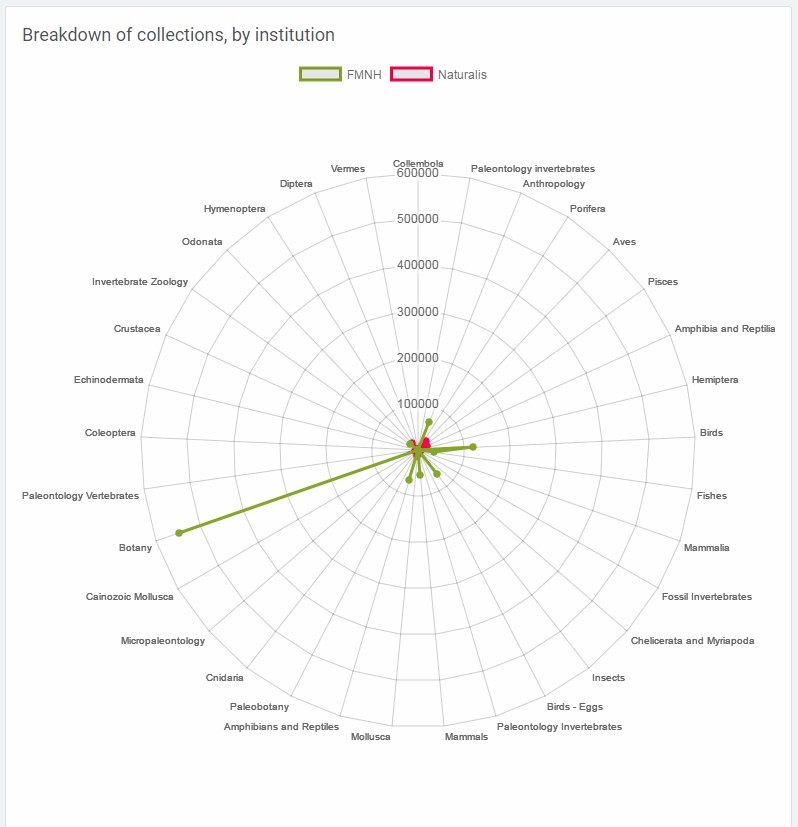
Breakdown of collections by institution
Radar chart showing the disciplinary breakdown of collections between institutions in the recordset. The further from the centre the point the more items. The values around the ring ae derived from the data and so may have case differences.
Record completeness (9 is best)
Explanation of ranking
- Digital accession record exists
- Total Object (lots) > 0 OR Total Items (specimens) > 0
- Locality of Accession record Not Null
- Catalogue # Not NULL
- Reverse attached catalogue records Not NULL
(Total Count - Count of Attachments > 0) - Has Digital Catalogue record
- Has Partial Data*
- PriCoordinateIndicator = Yes OR HasMultimedia = Yes
- PriCoordinateIndicator = Yes AND HasMultimedia = Yes AND Has **Full Data = Yes
* Partial Data (Has three or four of the following)
** Full Data (Has all five of the following)
IdeTaxonRef_tab.ClaRank = Family, Genus, species, subspecies or variety
DarStateProvince Not NULL
DarCollector Not NULL
DarYearCollected Not NULL
DarCatalogNumber Not NULL
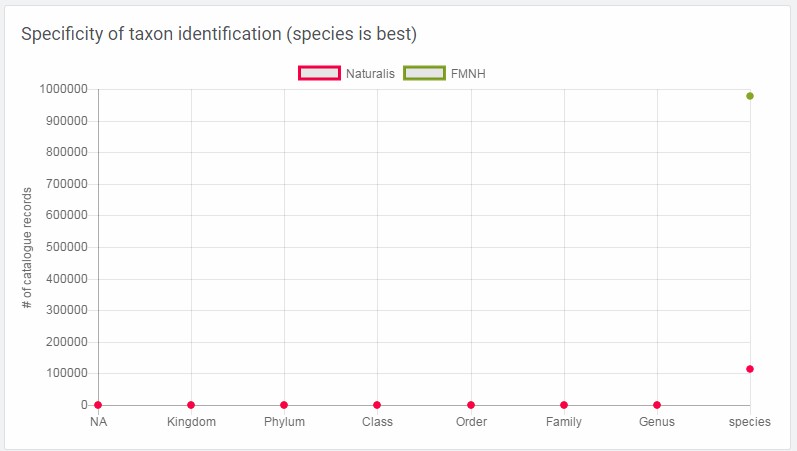
Specificity of taxon identification (species is best)
Taxonomic groupings/ClaRank are defined/grouped as follows:
species = "species", "subspecies", "variety", "Subvariety", "Form",
"Subform", "Proles", "Aberration"
genus <- c("Genus","Subgenus","Section","Subsection")
family <- c("Family","Subfamily","Tribe","Subtribe")
order <- c("Order","Suborder","Infraorder","Superfamily")
class <- c("Class","Subclass","Superorder")
phylum <- c("Phylum","Subphylum","Division")
kingdom = "Kingdom"
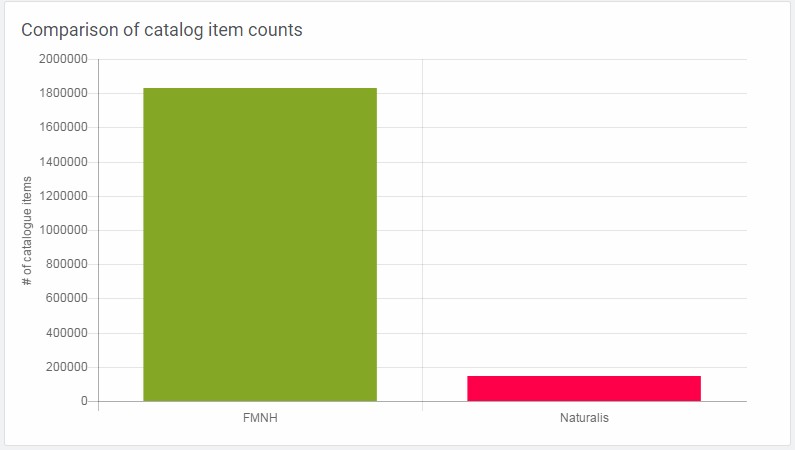
Comparison of catalog item counts
Displays to the total number of items for each institution included.
Record completeness (9 is best)
Explanation of ranking
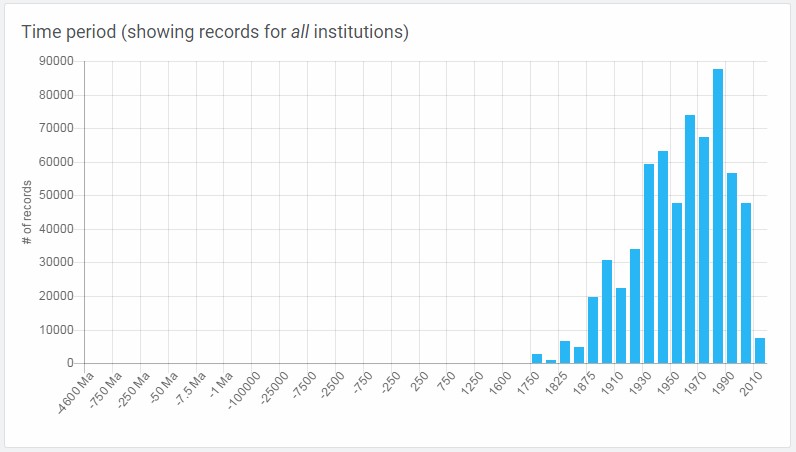
This chart displays time of existence/creation (this may or may not be date
collected). Before the 18th century, time along the x-axis is grouped in
increments analogous to geological time periods (ages, periods, epochs, etc).
Afterwards, it is grouped loosely in decades.
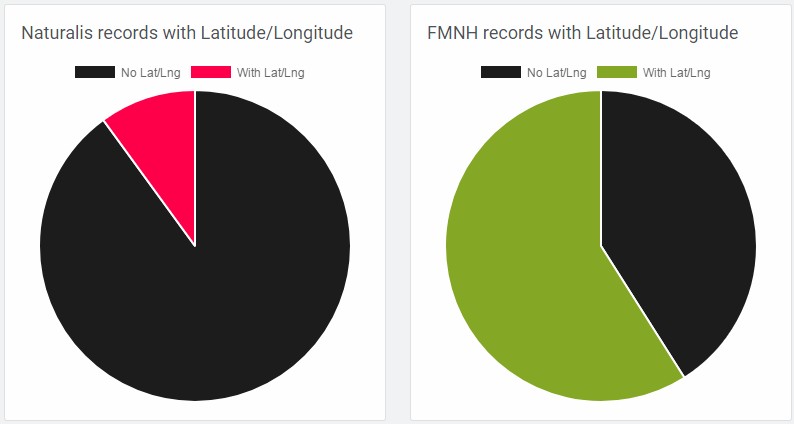
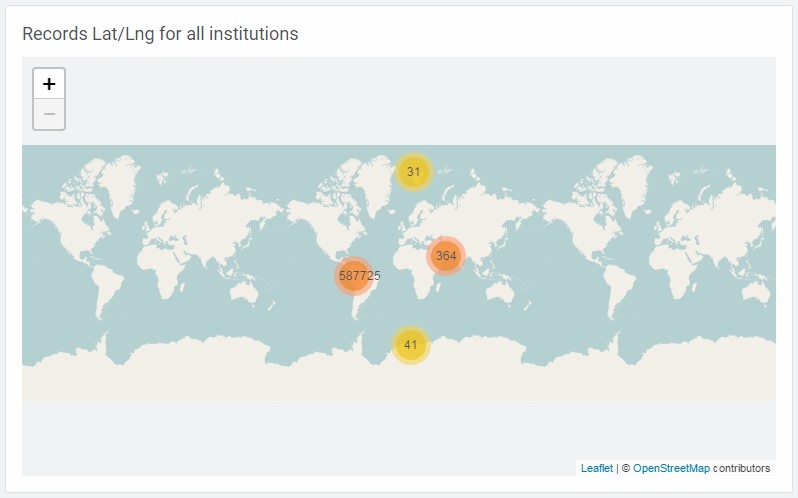
Records with Latitude/Longitude
Records with any coordinate value entered (valid or not) are included in these pie charts and displayed on the map.
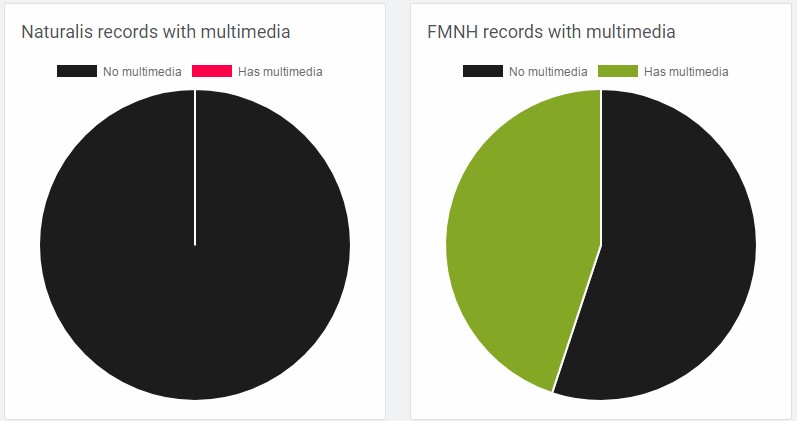
Records with multimedia
Records with an associated multimedia file are included in this pie chart. Includes images and other kinds of files.
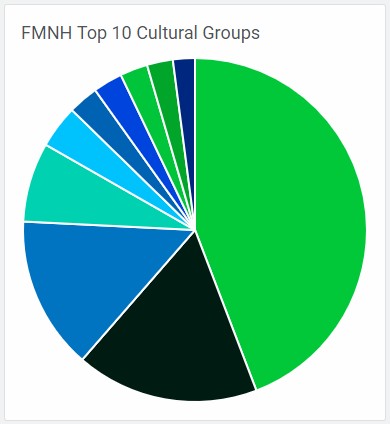
Who (top 10) breakdown
Count of the top 10 cultural group classifications from the search.
Global charts
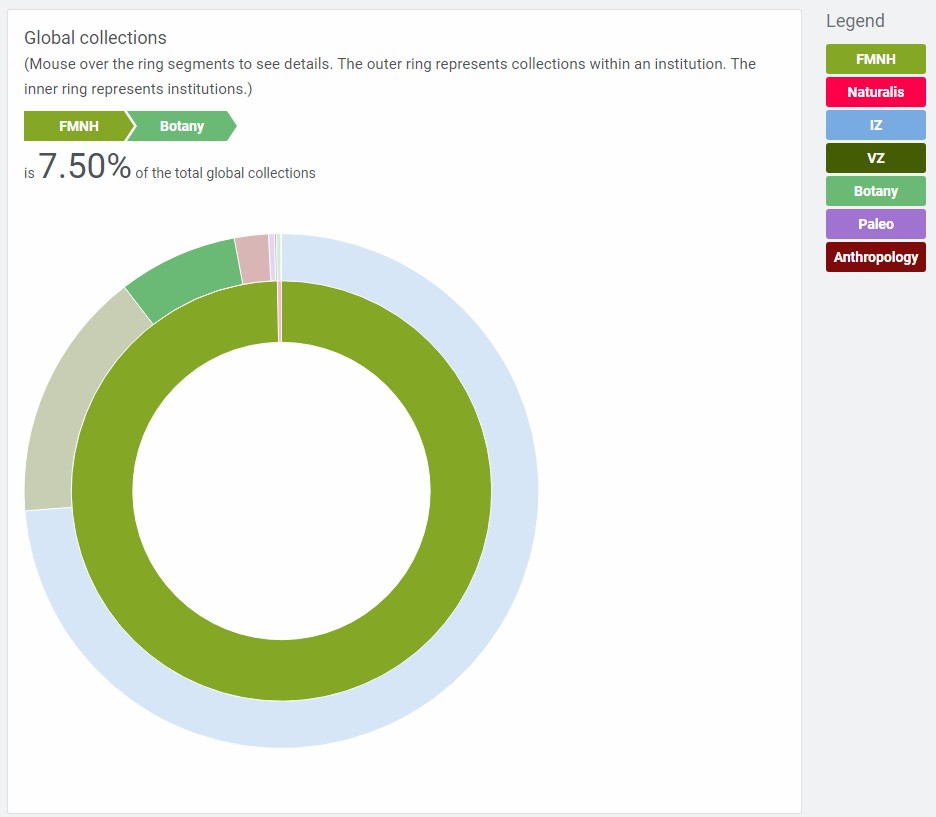
Global collections
The inner ring has one segment for each institution included in the full recordset. The total represents the sum of backlog and items.
The outer ring shows the research domains for each institution.
Highlighting a segment in the outer ring will display its percentage of all records.
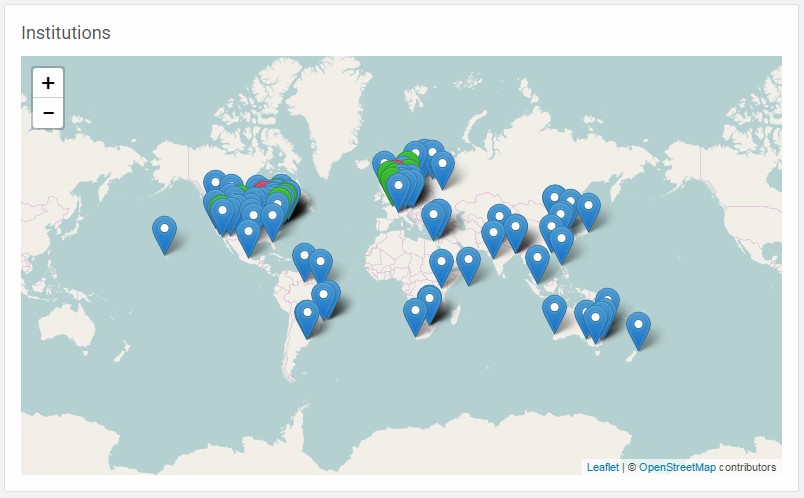
Institutions
This is a map of natural history museums and botanic gardens who together form the bulk of the global collection. Pink markers indicate that data is included in this dashboard.